New Release
A new way to interact with a smart building

An intuitive 2D view
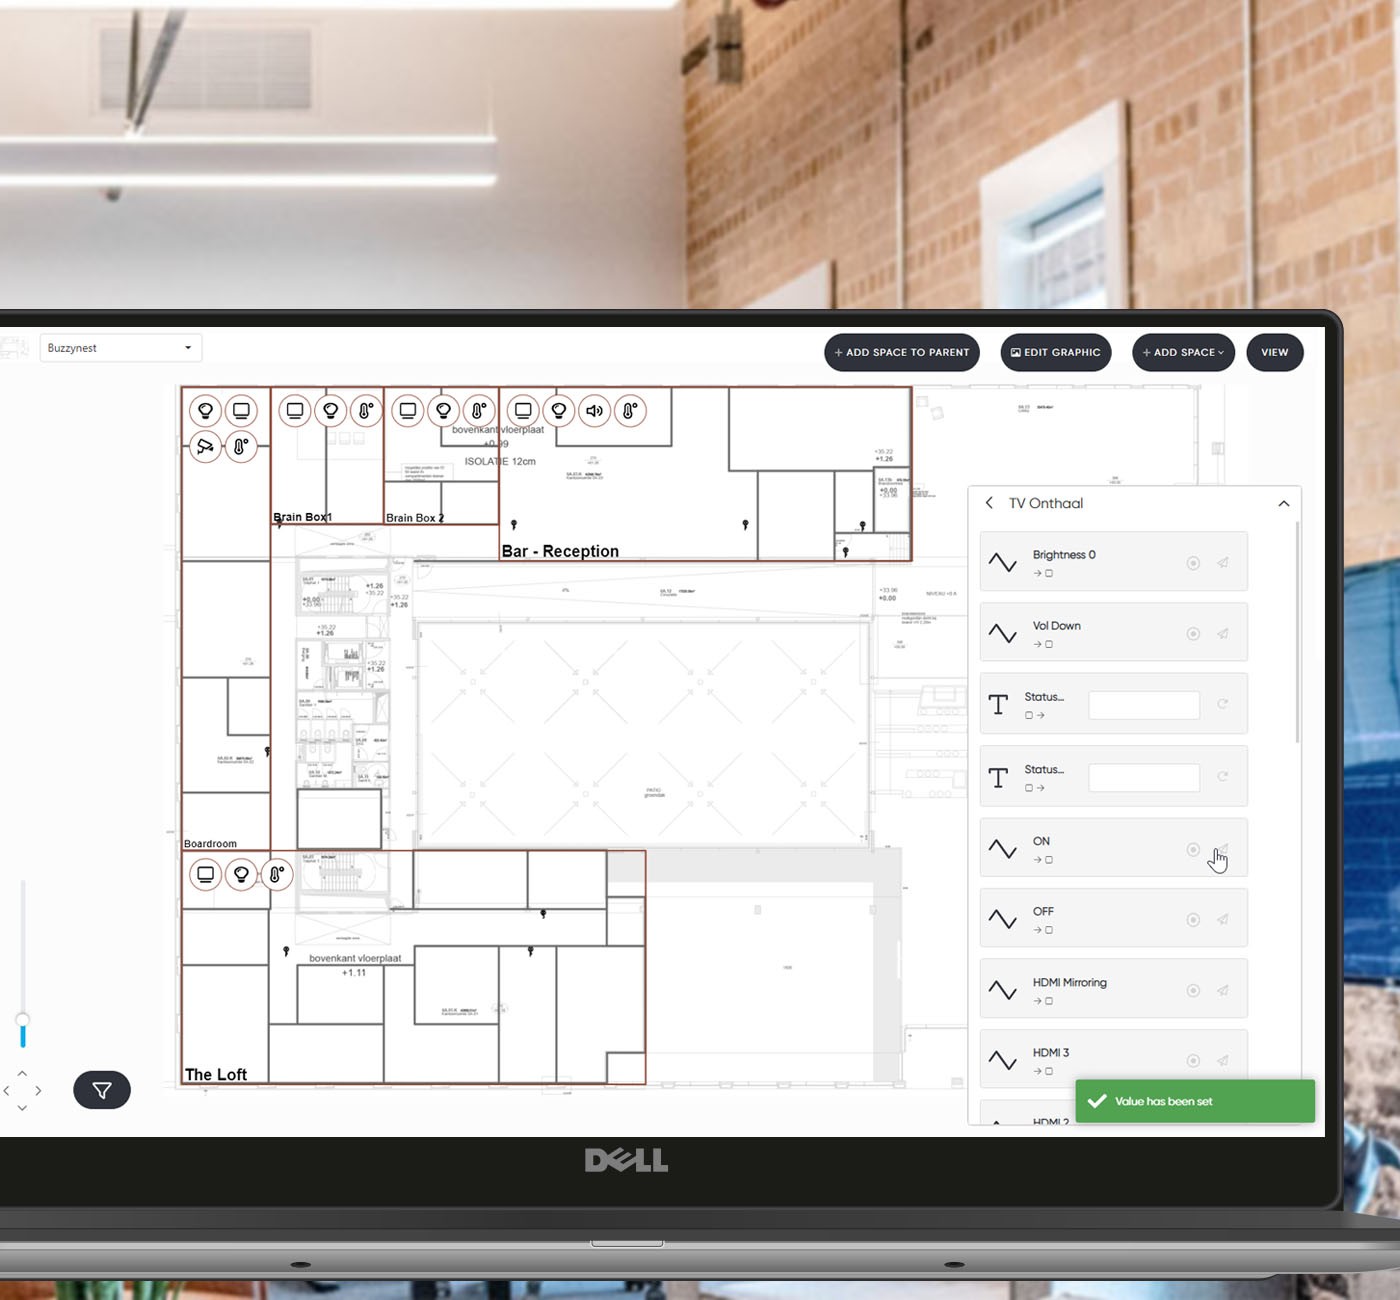
Trigrr 4.2 brings a great new feature. In addition to the space view where devices are displayed in a list, Trigrr now gives you the flexibility to configure, control and get a clear overview on a map. Explore a building floor by floor to locate a large number of devices and technologies. For each device, you can see all available features, create new connections and even test them in real time.
Display and control devices by type, functionalit or space. Filtering by device class is also possible to localize a technology throughout a building: HVAC, lighting, IoT, electricity, elevators, audio, video, access control,...
In view mode, you can also get live data for each room thanks to pre-defined filters: temperature, heating/cooling, lighting, occupancy, alarm…. You can also create your own filters.
This map is also available in the Trigrr user interface, a visual and easy solution made for Property managers, Building managers or office manager.
Add a 2D view button on this interface and embed a map on any available touchscreen or smartphone to check the status or interact with the building in a more immersive way.
Best practices
A Complete Building Ontology based on Bricks
From spaces to technology features, Trigrr builds a coherent view of your building operations thanks to this future-proof data model. Understand your building without technical knowledge. For example: a "meeting room" "door" can be "open/closed", a "parking lot" "light" can be "dimmed" to 60%, a hotel "bedroom" "TV" has a "volume" at 25%... with no distinction on device brands, protocols or silos.
In order to achieve this complete ontology, the functions have been grouped in order to search and interact with all the functionalities without having to edit each single device. This technical improvement is the first step towards batch configuration.
More insight!
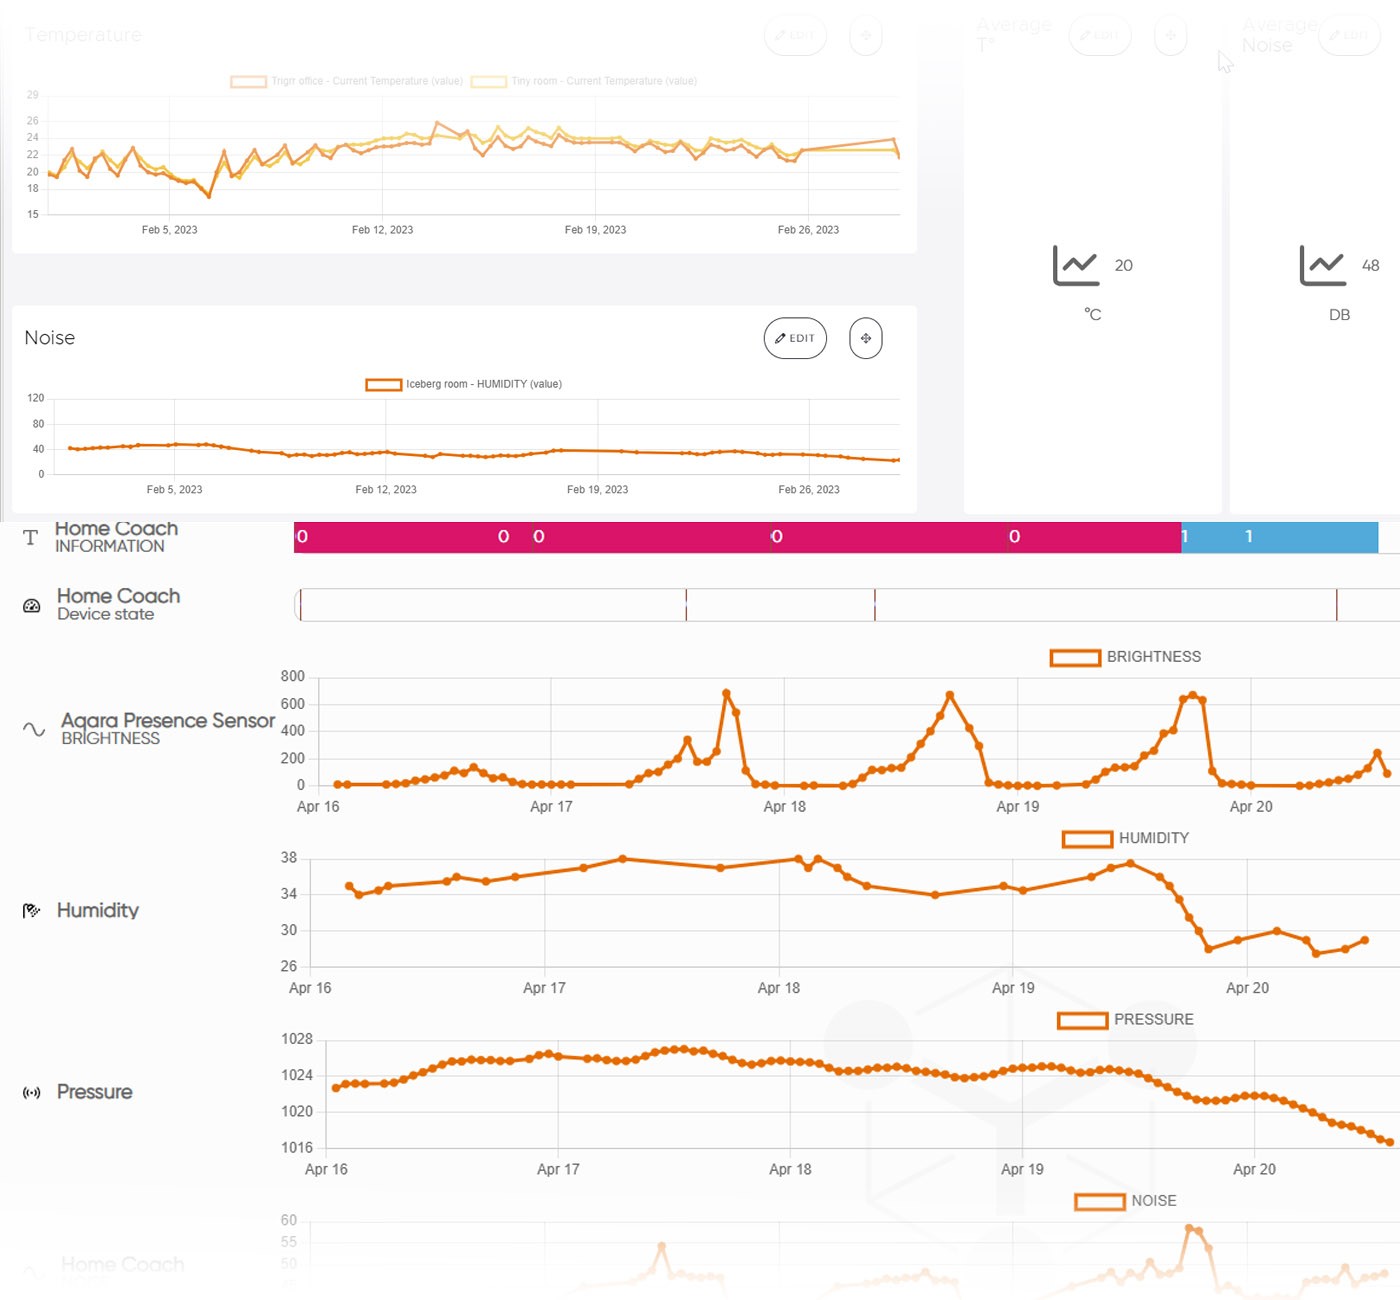
As you may already know, all the data centralized by Trigrr is available to create dashboards. Cross data from sensors, HVAC, lifts, lights, IoT and many more to create a powerful and visual dashboard. An owner or property manager can get a clear view of energy consumption, occupancy or any other relevant insight.
This 4.2 release brings a new kind of dashboarding that focuses on technical interactions. Get a complete history of every device interaction. Any technician can have a clear overview of hardware issues and be automatically notified when it's needed.
New protocols and improvements
- Connect a KONE lift to Trigrr at a glance! KONE lifts are now available in the Trigrr device library.
- The websocket protocol is now compatible with Tirgrr.
- Pictures and icones selection has been improved for a more efficient configuration
- Disconnection occurred sometimes with Helvar and Velbus gateways after short power cuts, this has been fixed.
Any technical questions of requests? Please feel free to contact our dev team